

At a glance
| Value | |
|---|---|
| Administration | A once-weekly injection. |
| Published half-life | about 5 days (roughly 117 hours) — Shorter than semaglutide, which is why the modelled curve falls further before the next dose arrives. |
| Dosing interval modelled | 7 days |
| Used in Cafeity for | The decay constant behind the Cycle View, and nothing else. |
Half-life figures are published population averages, used only as the decay constant in Cafeity's schedule model. They are not your pharmacokinetics, and nothing on this page is dosing information.
What tirzepatide is, in one paragraph
Tirzepatide is a dual GIP and GLP-1 receptor agonist — it acts at two gut-hormone receptors rather than one. As with every medication named on this site, that is the whole of the description here: indications, warnings, interactions and side-effect information belong on a label and with a clinician, and are linked at the foot of this page.
What follows is the part Cafeity is answerable for — how the published half-life shapes the modelled week, and what the record actually holds.
Why the same week looks different from semaglutide
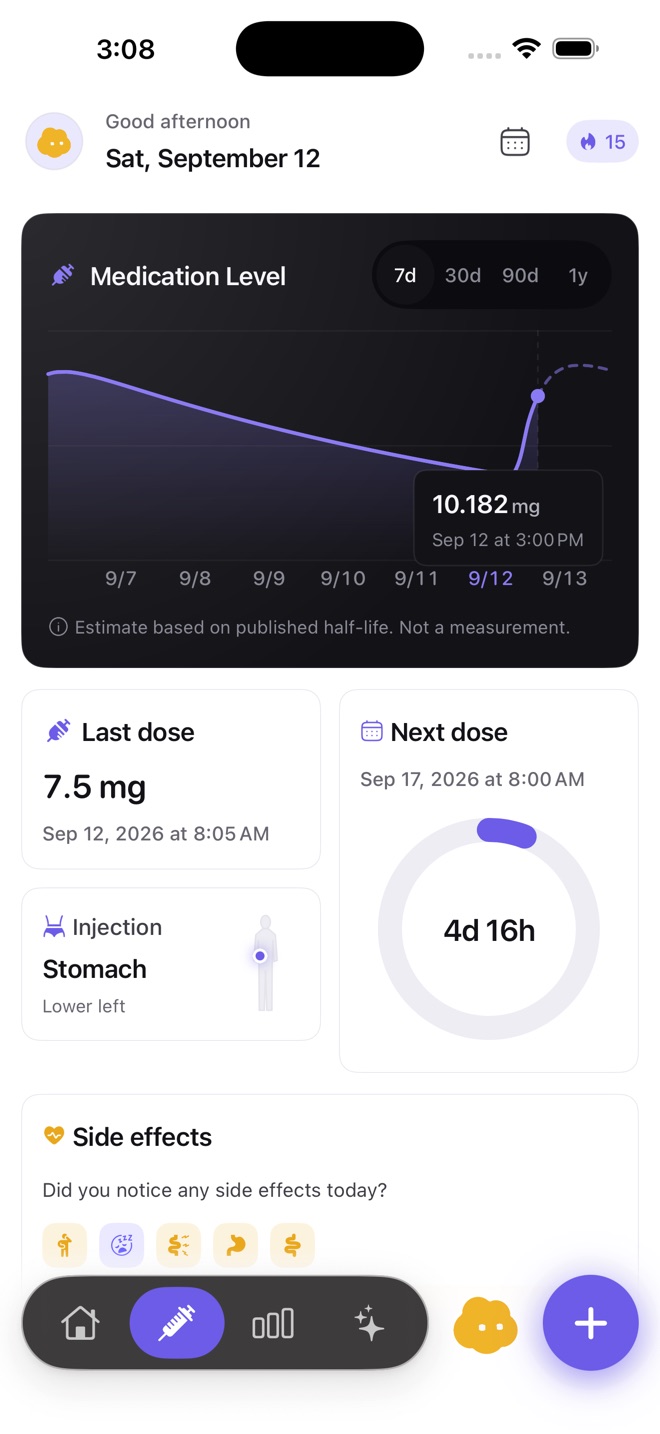
Cafeity uses one model for every medication: your logged dose dates, plus a published half-life. Change the half-life and the shape of the week changes with it — nothing else about the app differs. Roughly five days against roughly seven means the modelled curve falls further between doses and accumulates less across the first month.
That is a property of the model and the published figure, not a statement about you or about which medication is preferable. It is written down here so you can check the arithmetic rather than take a chart on trust.
How the Cycle View is worked out
The Cycle View is a schedule model, not a measurement. It takes the dose dates you logged, assumes each dose decays exponentially with the published half-life above, and adds them together. In full: level(t) = Σ 0.5 ^ ((t − tdose) / half-life), with one unit added per dose.
That is the entire mechanism. It knows nothing about your blood, your metabolism, your kidney function or the actual amount you were prescribed — which is why the y-axis below is unitless and relative to a single dose. The shape is the only part that means anything.

Accumulation and steady state
Because a dose arrives before the previous one has cleared, the modelled level builds for the first few weeks and then repeats. These figures fall straight out of the half-life — you can check every one of them on the half-life calculator.
| Value | Where it comes from | |
|---|---|---|
| Remaining when the next dose is due | 37% | 0.5 ^ (7 days ÷ 4.9 days) |
| Peak once settled | 1.59× a single dose | 1 ÷ (1 − remaining fraction) |
| Time to reach roughly 97% | about 24 days | five half-lives |
In other words, the first 3 weeks or so are not a typical week — the record is still describing a rising baseline. That is worth knowing before comparing week one with week ten.
What the record holds
Every entry below sits on one timeline, so any of them can be read against where you were in the medication cycle when it happened.
- Doses — date, time, the amount you were prescribed, and the medication as a plain label.
- Injection site, on a body map, so rotation is visible rather than remembered.
- Meals, with protein, fibre and hydration derived from what you logged.
- Symptoms, in your words, with your own severity rating.
- Weight and measurements, shown as a trend rather than a daily verdict.
Inside the app
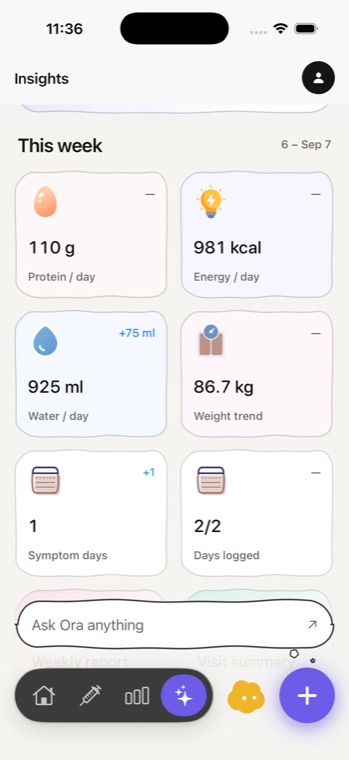
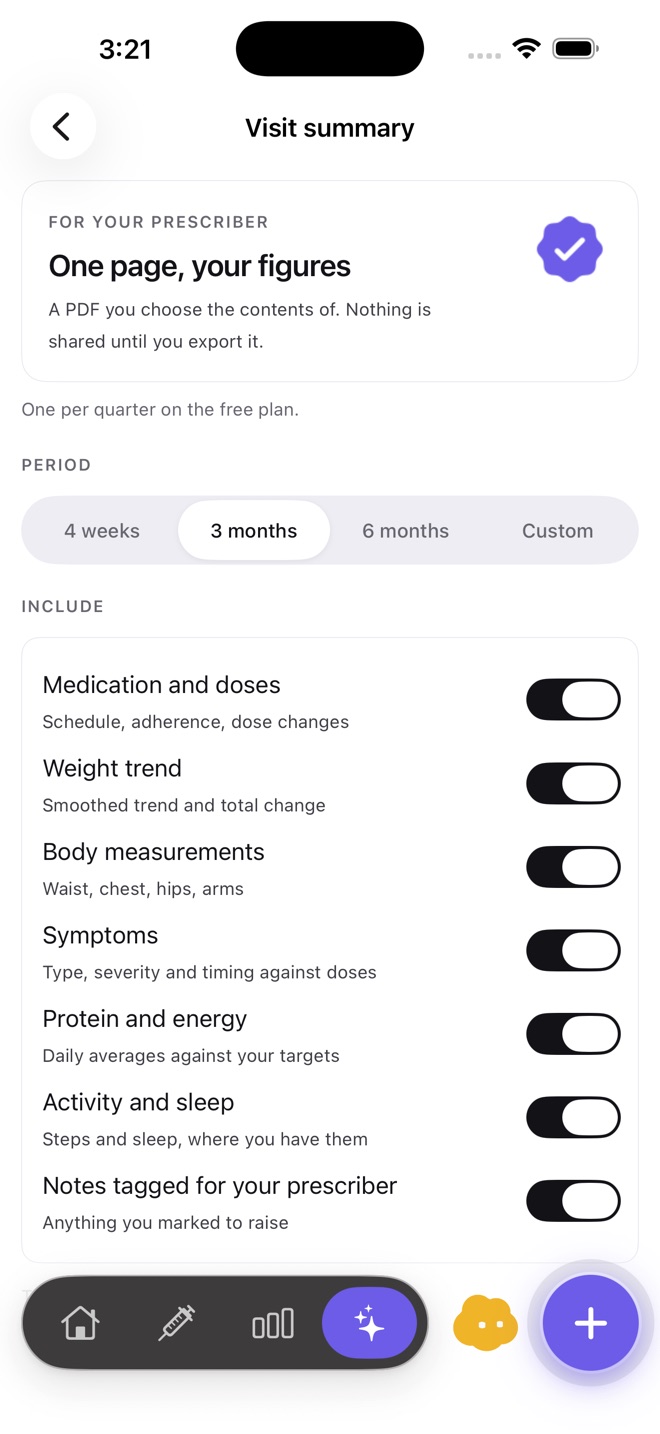
Screenshots from Cafeity on iPhone. The app is on the App Store; screens change as it is updated.
Beyond the dose record
The dose is the anchor, but it is not the whole record. Each of these has its own page.
- Protein comes first — appetite usually falls and total intake falls with it, so the figure worth watching is protein rather than calories. Cafeity derives a daily figure from body weight and shows the gap, without instructing you to change anything.
- Symptoms are recorded, not diagnosed — you log what you felt and how strongly; the app places it on the timeline and stops there.
- Weight is a trend, not a verdict — and never a prediction.
- Sites live on the dose record, so rotation is a glance rather than a guess.
Where your data lives
On your device and in your own account, under per-record permissions. Health data is never stored in iCloud, never sold, never used for advertising, and never used as training data.
You can export everything in one file at any time, and you can delete the record entirely. When you want to bring something to an appointment, the Visit Summary builds a one-page, print-ready PDF from a period and the sections you choose — and nothing leaves the phone until you do that yourself.
What Cafeity will never do
- Recommend, calculate or adjust a dose, or tell you when to take one.
- Interpret a symptom, name a condition, or suggest what is causing something.
- Predict how much weight you will lose, or when.
- Set a calorie target below 1,200 kcal, or a weight goal below a BMI of 18.5.
Cafeity is a general wellness product. It does not diagnose, treat, cure, mitigate or prevent any disease or condition. Questions about your treatment belong with a licensed healthcare professional.
Common questions
Why does my week look different from someone on semaglutide?
Does Cafeity handle dose changes?
Does it work with compounded tirzepatide?
Is my data used to train anything?
Further reading
Cafeity is a record-keeping tool, not a drug reference. Anything clinical — what a medication is approved for, who should not take it, what to watch for, how it interacts with other medicines — belongs with the sources below and with your own prescriber.
- Tirzepatide NHS
- Tirzepatide injection MedlinePlus
- Medicines A to Z NHS
- Drugs, Herbs and Supplements MedlinePlus, US National Library of Medicine
- DailyMed — FDA prescribing information US National Library of Medicine
External links open in a new tab. Cafeity is not affiliated with any of these organisations.