

How it is worked out
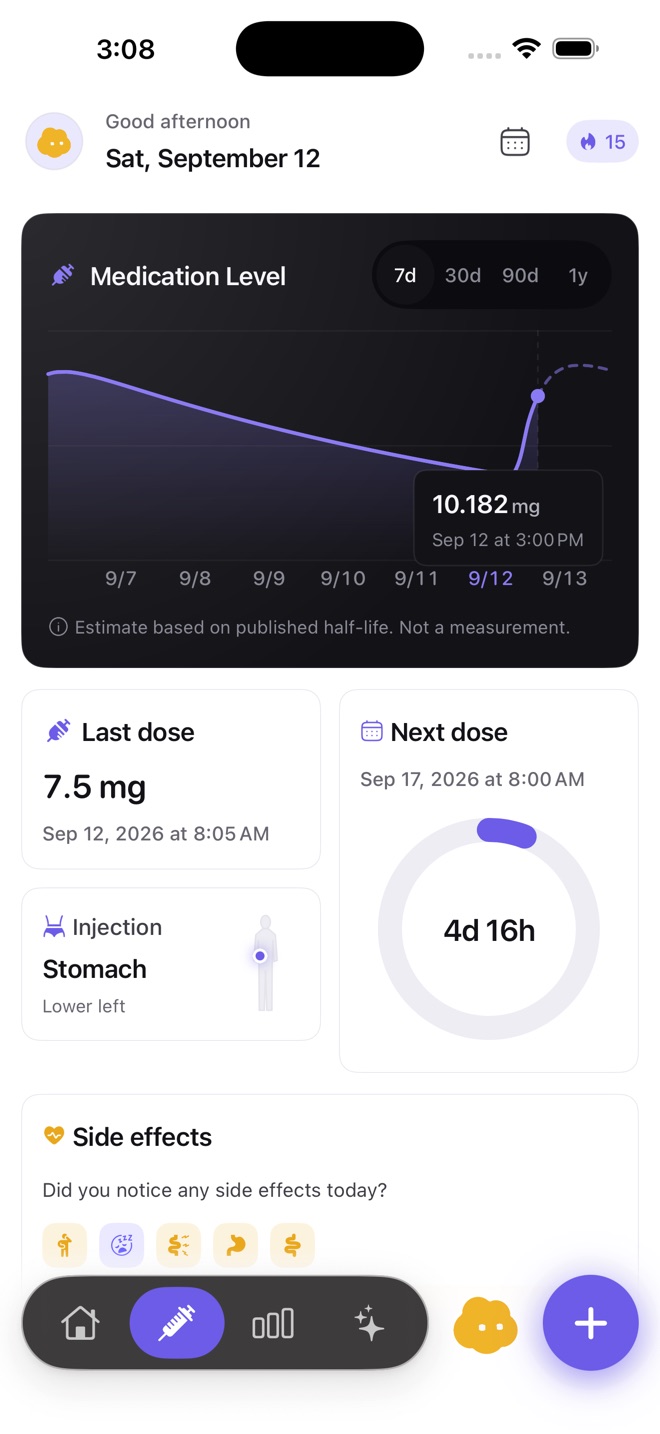
The model is deliberately simple, and fully disclosed: each dose you log contributes a level that halves every half-life, and the contributions are summed. In full, level(t) = Σ 0.5 ^ ((t − tdose) / half-life). That is all. It knows nothing about your blood, your kidneys or your metabolism, and the published half-life is a population average.
The same arithmetic is on the half-life calculator, where you can check any figure the app shows.
What it is for
- Reading symptoms against the cycle — is nausea worst a day or two after the injection, when the model peaks?
- Reading appetite and food noise — does hunger come back as the model falls towards the next dose? See food noise.
- Understanding the first weeks — the level builds for weeks before it settles, so week one and week eight are not comparable.
- Seeing the effect of a gap — a late or missed dose shows as a lower curve, which helps explain the days after it.
What it is not
It is not a blood test, not a prediction and not dosing information. Cafeity will never use it to suggest when to inject, how much to take, or whether to change anything — some apps market dose timing from exactly this kind of curve, and Cafeity deliberately does not, because a population model is nowhere near precise enough to time a medicine. The chart says "estimate" on the screen, every time.
Medicines it models
| Medicine | Half-life on the label | Usual interval |
|---|---|---|
| Semaglutide | About 1 week | Weekly injection or daily tablet |
| Tirzepatide | About 5 to 6 days | Weekly injection |
| Dulaglutide | About 5 days | Weekly injection |
| Liraglutide | About 13 hours | Daily injection |
| Orforglipron | About 29 to 49 hours | Daily tablet |
| Exenatide (twice daily) | About 2.4 hours | Twice-daily injection |
What it will never do
- Recommend, calculate or adjust a dose, or tell you when to take one.
- Interpret a symptom, name a condition, or suggest what is causing something.
- Predict how much weight you will lose, or when.
- Set a calorie target below 1,200 kcal, or a weight goal below a BMI of 18.5.
Cafeity is a general wellness product. It does not diagnose, treat, cure, mitigate or prevent any disease or condition. Questions about your treatment belong with a licensed healthcare professional.
Keeping a record of it
Screens from Cafeity on iPhone.

Common questions
Is the Cycle View my actual blood level?
Will the Cycle View tell me when to inject?
Is the Cycle View free?
Sources
- Semaglutide injection and tablets for weight management — US prescribing information DailyMed, US National Library of Medicine, version published 30 June 2026
- Tirzepatide injection for weight management and obstructive sleep apnoea — US prescribing information DailyMed, US National Library of Medicine, version published 2 September 2026
- Liraglutide 3 mg injection for weight management — US prescribing information DailyMed, US National Library of Medicine, version published 15 June 2026
- Orforglipron tablets for weight management — US prescribing information DailyMed, US National Library of Medicine, version published 13 August 2026
- Dulaglutide injection — US prescribing information DailyMed, US National Library of Medicine, version published 10 August 2026
- Exenatide twice-daily injection — US prescribing information DailyMed, US National Library of Medicine, version published 8 September 2025
Written by the Cafeity team from the sources listed here. Figures from prescribing information are quoted as the label states them; trial results are averages from those trials, not predictions for any one person. This page has not yet been reviewed by a clinician — see the editorial policy for how pages are researched and corrected.